From Excel to Business Intelligence tools – the evolution of the spreadsheet

Kinga Grabowska
Reading time: 6 min
 Date: 26 May 2022
For many years, organisations based their analysis solely on excel sheets, accumulating business intelligence in them.
This was an entirely sufficient solution for analysing the data collected. If the introduction of Excel was such a big help for companies, what has made businesses eager to implement business intelligence tools? Well, over the past 20 years, we can see a huge development in the area of not only technology, but also in the area of business automation. However, before we get to that, let’s go back in time a bit….
A long time ago, in the distant cells of a spreadsheet…
In 1985, Excel broke into businesses around the world, making it easy for users to perform mathematical functions on data. Interestingly, the first version of the software was released on the Macintosh, Apple’s first computer. In 1987, Excel lived to see a version dedicated to Windows and thus grew in popularity, establishing a permanent presence in organisations.
It may seem that the concept of Business Intelligence software is a technological novelty, but nothing could be further from the truth, as Qlik, which was born in Sweden, debuted its first BI solution on the market as early as 1994, revolutionising the culture of data analysis and opening up a new range of possibilities for companies to read their business.
Data analysis – how to go about it?
Excel has for many years been the leading analytical solution in Poland and also the basis for the data analysis process. The entry point is relatively low, primarily due to the wide availability of the tool and its price. There are many organisations at a stage of development for which this tool is completely sufficient and they have no need to look for alternatives and increase their capabilities. There is nothing wrong with this, after all, to each his own.
If a company’s appetite for data collection and processing grows, the next step is usually to implement an ERP system that collects data from various areas. If, on the other hand, the hunger for information is great enough and the need for a holistic, multidimensional view of data arises, a business intelligence tool such as Qlik Sense comes to the rescue.

Why are organisations choosing to move from Excel to BI tools?
Change is an inherent part of our lives, as well as business. The sooner we accept this state of affairs, the better attitude we will approach our next ventures with. The easiest way to observe the pace of change is to look at technology companies – something that is an innovation today may be displaced by a competing, improved solution in two weeks, one month or six months. Given that we easily become accustomed to these solutions that enhance our comfort level, here are some arguments why organisations choose Business Intelligence systems:
- Optimisation – continuous improvement is embedded in running a business that is responsive to current needs. Fixed costs, variable costs, logistics, headcount, overdue payments – there are a whole host of areas where companies can improve, developing increasingly time-, quality- and cost-efficient processes – but to do this, you need data. Qlik Sense allows you to gather data from a variety of sources and develop reports to feed in new data, without having to prepare it each month. This saves time for the people who work on the reports and they can focus on the data analysis itself. We therefore gain a powerful tool for company knowledge.
- Excel becomes inefficient, the time taken to load reports increases significantly – it is estimated that data in organisations grows by an average of 63% compared to the previous month*,
- Limitation of analysed rows and columns – in Excel, we have a hard limit of 1,048,576 rows by 16,384 columns, while when it comes to Business Intelligence systems, we are limited only by the amount of basic memory (RAM) of the computer, which, however, can be increased as required, resulting in almost unlimited possibilities of using Qlik and even greater comfort in using the tool.
- Multidimensional data analysis – organisations increasingly want not only to see data, but above all to get information on where it comes from,
- All the data in one place – the Business Intelligence system aggregates all the data about the company from different systems, becoming a single source of truth about the organisation – all the people in the organisation use the same data model, which is no longer so obvious in the case of Excel, as each user can influence the data, which can result in business decisions that are not necessarily right,
- Increased information security – no deletion of data, as can happen with an Excel file – we have a backup and, in addition, we are assured that only authorised people have access to a given set of data,
- Low entry threshold for users – there is no need to write commands or macros, we only use filtering and a simplified drag and drop system,
- Simultaneous work of people on the same application – in Qlik Sense, any number of people can simultaneously work on the same application or the same dashboard. In shared Excel, this is not possible because when one user uses filtering, the filters switch for each user using the file at the same time, so individual exploration at the same time is not possible.
- Ease of system redevelopment due to the lack of a rigid OLAP cube structure – this allows us to change the data architecture freely – we are rarely able to define in advance the functionalities that may be useful to us in a few months/years. Qlik, meeting the need for quick changes without having to rebuild the entire system, allows us to make them and thus adapt to changes.
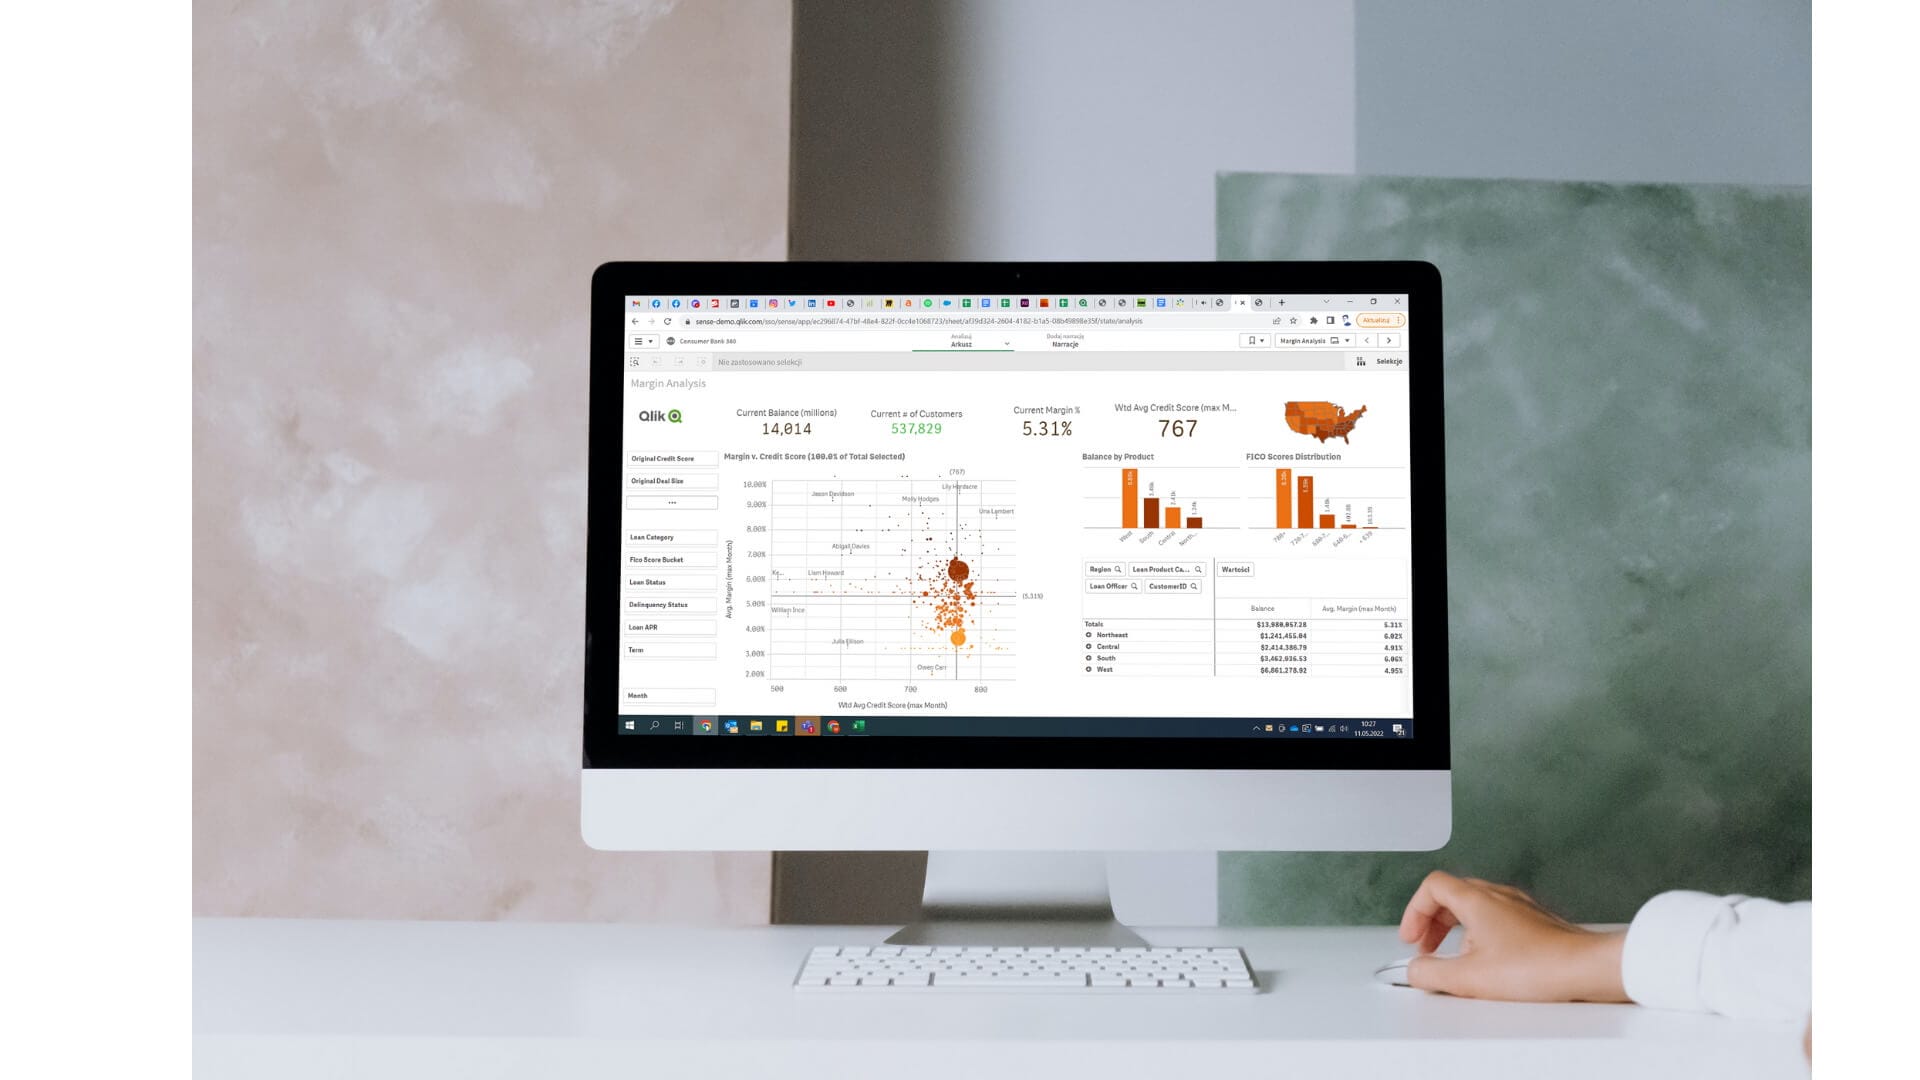
- The many possibilities for data visualisation in Qlik Sense – the human mind is far better at understanding information presented through images and visualisations than tables and numbers. The strength of the business intelligence tool lies in the fact that when analysing dashboards, users view the data presented in the form of visualisations, so they encode information faster and catch repetitive patterns in the data. This translates into better and, above all, faster understanding of the data and making the right decision.

Comparison of the functionalities of Qlik Sense and MS Excel:
| Functionality | Qlik Sense | Excel |
| Functions | ✅ | ✅ |
| Data visualization | ✅ | ✅ |
| Charts | ✅ | ✅ |
| Dedicated templates | ✅ | ✅ |
| Mobile application | ✅ | ✅ |
| Trend analysis | ✅ | ✅ |
| Drag and drop system | ✅ | ✅ |
| Ad hoc enquiries | ✅ | ❌ |
| Ad hoc reports | ✅ | ❌ |
| Dedicated dashboards | ✅ | ❌ |
| API | ✅ | ❌ |
| Reporting and statistics | ✅ | ❌ |
| Real-time notifications | ✅ | ❌ |
| Role-dependent data access | ✅ | ❌ |
| Integrations with other systems | ✅ | ❌ |
| Calculator | ❌ | ✅ |
| File sharing | ❌ | ✅ |
| Administration/management of notes | ❌ | ✅ |
How to easily check if a Business Intelligence tool will work for your company?
It is often said: “you won’t know until you try”, which is exactly the case here. Most of the popular BI tools offer free trial versions and support in the form of additional materials to make working with the platform easier, especially at the beginning. Qlik also offers such an opportunity, where for 30 days, at no cost, you can test Qlik Sense without restrictions, either on-premise or in the cloud (SaaS).
I encourage you to carry out such an experience and try Qlik in your daily work with data and reports. To carve out a test licence, please send an email to: bpx@bpx.pl
Source:
 Author:
Kinga Grabowska
Sales Representative Qlik
See recent writings
You drive us to strive for excellence in delivered projects and common challenges. Feel invited to read out blog that provides more in-depth knowledge on our implementations and experience. Read articles about digital business transformation, ERP and Business Intelligence systems. Discover interesting practical applications for future technologies.
- Blog
Navigating the challenges of introducing new software in a company – the role of technology and social dynamics
Contact us!
Let’s talk! Are you interested in our solutions? Our experts are happy to answer all of your questions.
 pl
pl


